The December 4, 2002 Total Solar Eclipse

On Wednesday, December 4, 2002, a solar eclipse was visible in the southern hemisphere. Within a narrow corridor crossing southern Africa, the Indian Ocean, and southern Australia, a total eclipse (lasting a maximum of 2 minutes 4 seconds) occurred. A partial eclipse was visible over approximately two thirds of Africa, Antarctica, the Indian Ocean, and Australia. For a detailed description of the eclipse path, see Fred Espenak’s 2002 Solar Eclipse web site.
On November 26, 2002, we initiated an MHD computation of the solar corona, in preparation for our prediction of what the solar corona would look like during this eclipse. We used photospheric magnetic field data from Carrington rotation 1995 (corresponding to the dates October 6 – November 3, 2002) from the National Solar Observatory at Kitt Peak. Subsequently, we updated the magnetic field data in the simulation with the latest data available on November 27, 2002, and again on December 1, 2002. The eclipse prediction, based on this simulation, is shown below. Magnetic and plasma properties of the solar corona and inner heliosphere during this time period can also be obtained from our modeling web site.
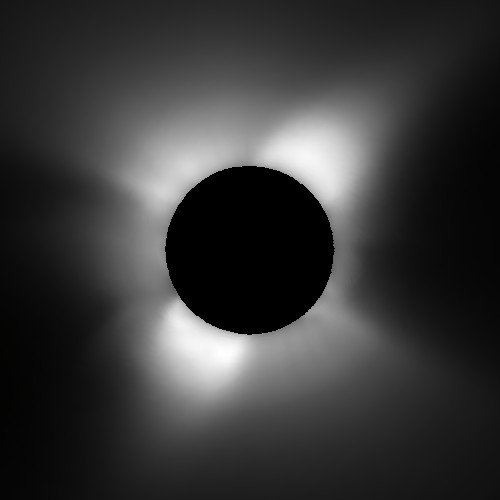
Predicted polarization brightness (pB) in the solar corona for the eclipse expected on December 4, 2002 at 06:00 UT (corresponding to totality in Angola). The state of the solar corona was computed using a 3D magnetohydrodynamic (MHD) simulation. The pB signal is produced by white light scattered off electrons in the coronal plasma. The image has been radially detrended to account for the fall-off of coronal brightness with distance from the Sun. Vertical (top) is terrestrial (geocentric) north. This is the view of the Sun that would be seen by an observer on Earth with a camera aligned so that vertical is toward the Earth’s north pole. Views aligned with solar north are on the original solar-north page.
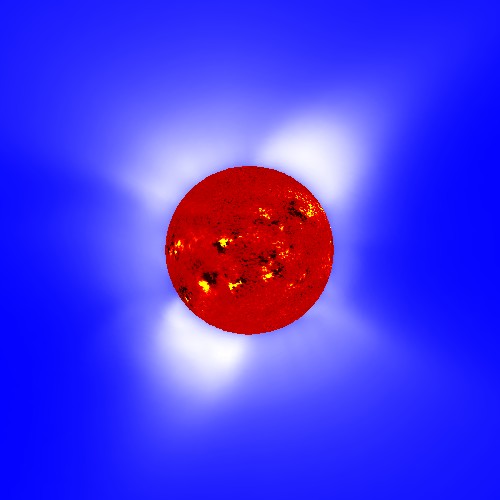
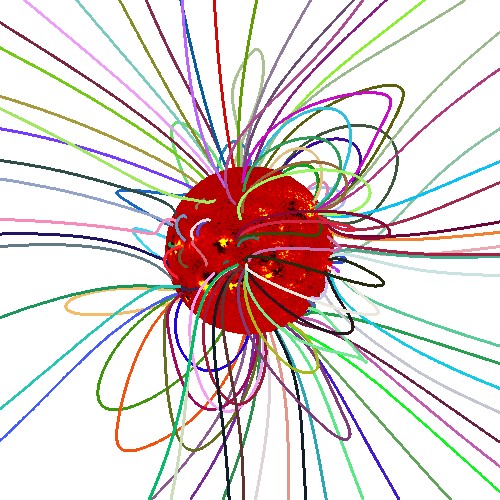
Predicted polarization brightness (left) together with traces of the magnetic field lines in the solar corona (right) for the eclipse expected on December 4, 2002 at 06:00 UT (with terrestrial north up). The Sun’s surface shows color contours of the radial component of the measured photospheric magnetic field from Kitt Peak National Solar Observatory, showing the location of active regions (strong magnetic fields).
Model Comparison with an Eclipse Photograph Taken in South Africa and Images from the SOHO Spacecraft
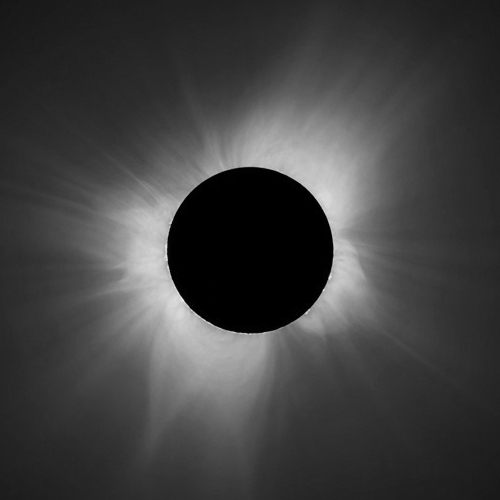
(a) Image from South Africa(courtesy of Wendy Carlos*)
(b) MHD Model PredictionPolarization Brightness
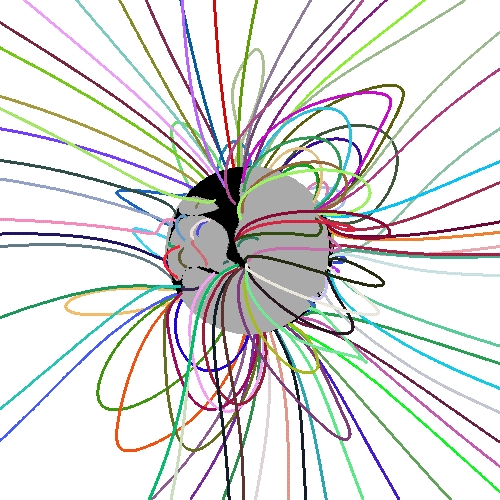
(c) MHD Magnetic Field Linesand Coronal Hole
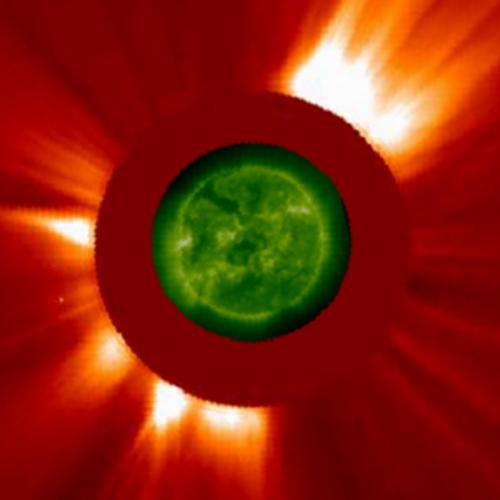
(d) LASCO C2 + EIT Composite(SOHO**)
From left to right: (a) an eclipse image taken in Messina, South Africa. The eclipse image is a computer composite and optimization from several negatives taken by Wendy Carlos, merged with images taken with radially graded filters by Jonathan Kern. (b) the predicted polarization brightness from the MHD model. (c) the magnetic field (colored lines) and estimated coronal hole (black) from the MHD model. (d) a superimposition of the EIT emission (green) and LASCO C2 image (orange) close to eclipse time. The images have terrestrial (geocentric) north vertically upward. *Eclipse Image: © 2002 Wendy Carlos and Jonathan Kern – All Rights Reserved. For details, see wendycarlos.com/eclipse.html. **Courtesy of the SOHO/EIT & LASCO consortia. SOHO is a project of international cooperation between ESA and NASA.
Evolution of the Photospheric Magnetic Field
The photospheric magnetic field maps we use for our calculations are built up from daily observations of the Sun during a solar rotation. These maps give a good approximation of the Sun’s magnetic flux if the large-scale flux is not changing much throughout a rotation. Previously, we have computed coronal models for an eclipse during the declining phase of the last solar cycle (November 3, 1994), for two eclipses during solar minimum (October 24, 1995 and March 9, 1997), one eclipse during the early rising phase of solar cycle 23 (February 26, 1998), one eclipse approaching solar maximum (August 11, 1999), and one eclipse at solar maximum (June 21, 2001). The December 4, 2002 eclipse, although occurring approximately one year after the peak of solar maximum, presented a significant challenge. The photospheric magnetic field was evolving rapidly, making synoptic magnetic field data a less reliable approximation to the true state of the photospheric magnetic field.
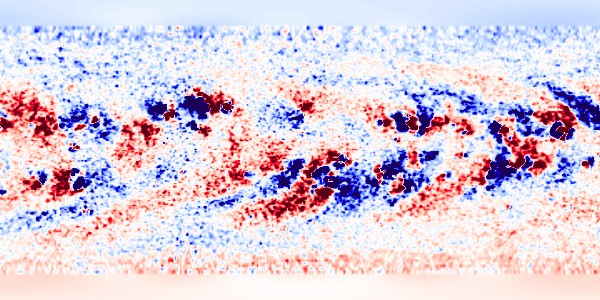
CR1995 (Oct 6 – Nov 3, 2002)
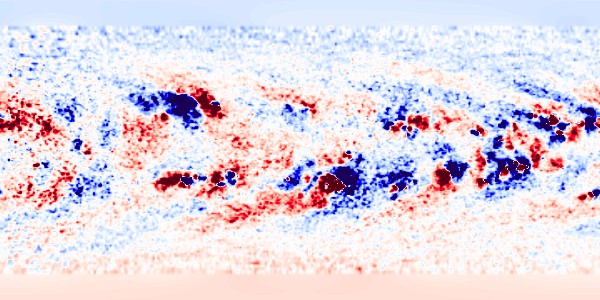
CR1995+1996 (Oct 29 – Nov 25, 2002)
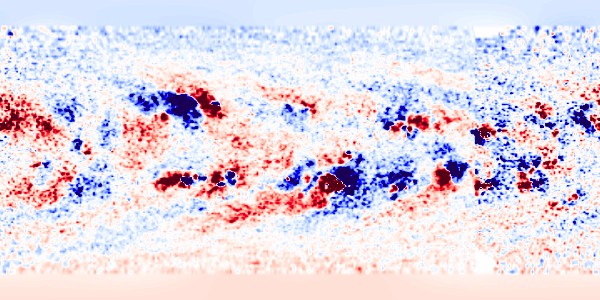
CR1996+1997 (Nov 4 – Dec 1, 2002)
These figures show the photospheric magnetic field maps for three Carrington rotations, CR1995, CR1995+1996, and CR1996+1997, as measured by the National Solar Observatory at Kitt Peak. The maps show the measured photospheric magnetic field as a function of latitude (vertical axis) and Carrington longitude (horizontal axis). Red shows outward directed magnetic flux, and blue shows inward directed flux. These maps are considerably more complex than maps during solar minimum.
Movies
We have made a movie of the polarization brightness from our MHD simulation. This illustrates visually how rapidly the solar corona changes as a result of solar rotation during the maximum phase of the solar cycle.
Polarization Brightness(Carrington Rotation 1996)
Publications
For technical details about our model, please see the publications:
- Z. Mikić, J. A. Linker, D. D. Schnack, R. Lionello, and A. Tarditi, “Magnetohydrodynamic Modeling of the Global Solar Corona,” Physics of Plasmas, 6, 2217 (1999).
- Z. Mikić, J. A. Linker, P. Riley, and R. Lionello, “Predicting the Structure of the Solar Corona During the 11 August 1999 Total Solar Eclipse,” in The Last Total Solar Eclipse of the Millennium, Proceedings of the Conference held in Istanbul, Turkey, 13–15 August, 1999 (W. Livingston and A. Ozguc, eds.), ASP Conference Series, Vol. 205, p. 162 (2000).
Other Web Resources for the Eclipse
- Fred Espenak’s 2002 Total Solar Eclipse web site (a great resource for the eclipse, including lots of information and links to other sites).
- Sky and Telescope Magazine.
- MrEclipse.com.
Archived prediction, converted from the original 2002 page. The movie originally offered as a QuickTime/MPEG/AVI download is embedded above.