The February 26, 1998 Total Solar Eclipse
On February 26, 1998, a total solar eclipse occurred in the northern part of South America and in the Caribbean Sea. On February 13, 1998, we performed an MHD computation of the solar corona to predict what the solar corona would look like during the eclipse. We used photospheric magnetic field data from Carrington rotations 1931 and 1932 (corresponding to the approximate dates January 18 – February 12, 1998) from the National Solar Observatory at Kitt Peak. (We would especially like to thank Jack Harvey and the staff at NSO Kitt Peak for their timely help in providing us with the latest data.)
Several eclipse expeditions and coordinated observations with the SOHO spacecraft were carried out during the eclipse. An eclipse conference, “Les Jets Solaires et les Plumes Coronales,” occurred in Guadeloupe in the path of the eclipse.
For a comparison between our prediction and an image taken on the day of the eclipse, see below.
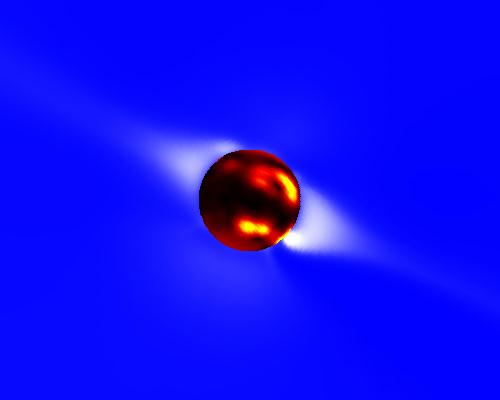
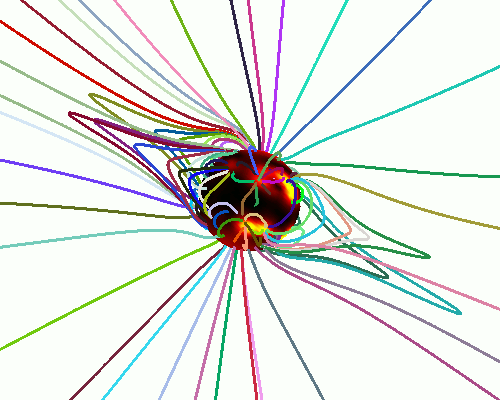
Predicted polarization brightness (pB) and traces of the magnetic field lines, in arbitrary colors, in the solar corona for February 26, 1998, at 18:31 UT (corresponding to a Carrington longitude of 256 degrees at central meridian). The pB signal is produced by white light scattered off electrons in the coronal plasma. The brightest regions, known as helmet streamers, occur where the magnetic field lines are closed. The image has been radially detrended to account for the fall-off of coronal brightness with distance from the Sun. Vertical (top) is geocentric (terrestrial) north. This is the view of the Sun that would be seen by an observer on Earth with a camera aligned so that vertical is toward the Earth’s north pole.
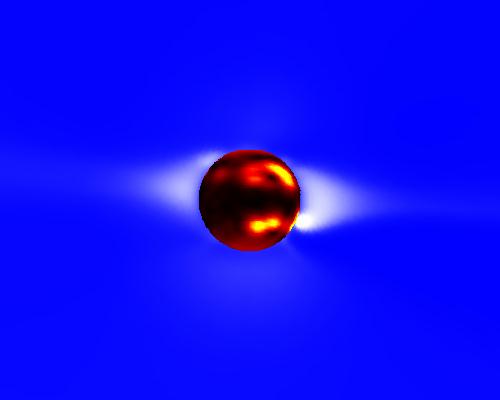
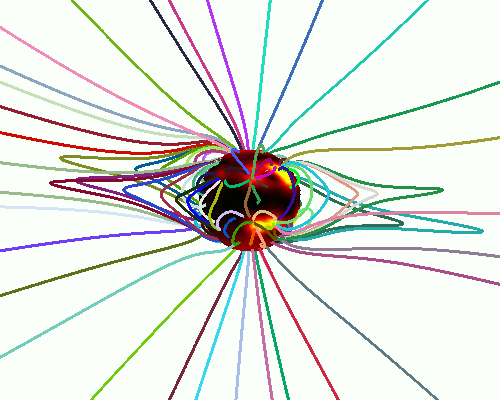
Predicted pB and traces of the magnetic field lines for the same calculation as above; here vertical (top) is heliocentric (solar) north. This is the view of the Sun that would be seen by an observer on Earth with a camera aligned so that vertical is toward the Sun’s north pole.
Evolution of the Photospheric Magnetic Field
The photospheric magnetic field maps we use for our calculations are built up from daily observations of the Sun during a solar rotation. These maps give a good approximation of the Sun’s magnetic flux if the large-scale flux is not changing much throughout a rotation. The past three eclipses (November 3, 1994, October 24, 1995, and March 9, 1997) occurred during the declining phase of the last solar cycle and in solar minimum, when the magnetic field on the Sun is changing slowly. The solar cycle is now in a rising phase, and the photospheric magnetic field is beginning to change more rapidly than in the past couple of years. This makes the job of predicting coronal structure from photospheric magnetic field observations more difficult.
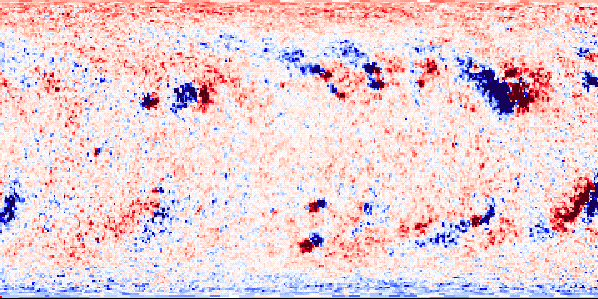
CR1930
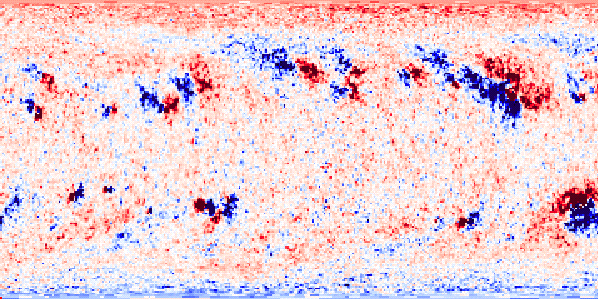
CR1931
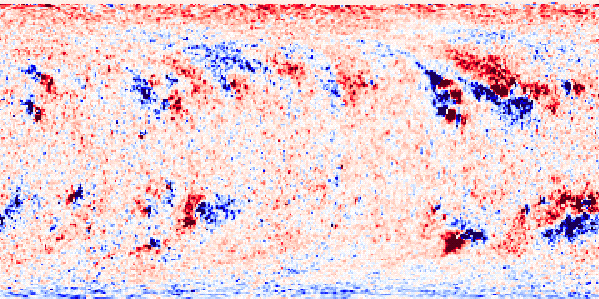
CR1931+CR1932
Photospheric magnetic field maps for two recent Carrington rotations, and a combination of CR1931 and CR1932, as measured by the National Solar Observatory at Kitt Peak. The maps show the measured photospheric field as a function of sine(latitude) (vertical axis) and Carrington longitude (horizontal axis). Red shows outward directed magnetic flux, and blue shows inward directed flux. CR1930 (Carrington rotation 1930) shows magnetic field observations obtained during November 28 – December 26, 1997; CR1931 shows observations during December 26, 1997 – January 22, 1998; and CR1931+CR1932 shows observations during January 18 – February 12, 1998. New sunspot groups are appearing and older ones dispersing more rapidly with the rise of the solar cycle.
Comparison with an Actual Eclipse Image
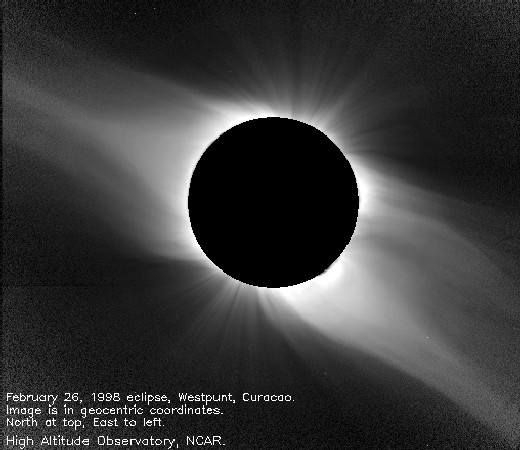
Eclipse Image(HAO, Curacao)
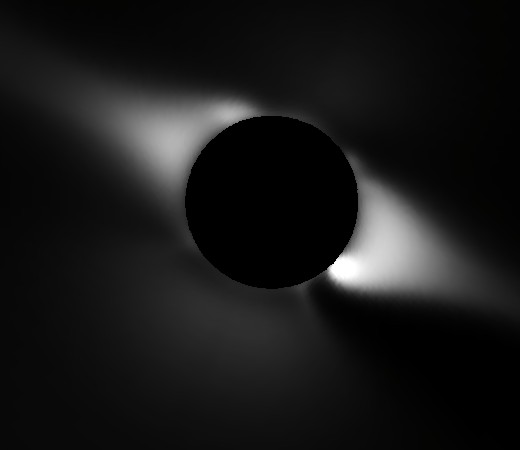
MHD Model PredictionPolarization Brightness
On the left is an eclipse image taken by a team from the High Altitude Observatory in Curacao. (The eclipse image is courtesy of Alice Lecinski from the High Altitude Observatory, National Center for Atmospheric Research, Boulder, Colorado. NCAR is sponsored by NSF.) On the right is the pB predicted by our MHD computation for the approximate eclipse time. Vertical (top) is geocentric (terrestrial) north.
Archived prediction, converted from the original 1998 page.