The March 9, 1997 Total Solar Eclipse
On February 28, 1997, we performed an MHD computation of the solar corona to predict what the solar corona would look like during the total solar eclipse of March 9, 1997. We used photospheric magnetic field data for the period January 30 – February 26 (Carrington rotations 1918 and 1919) from Wilcox Solar Observatory.
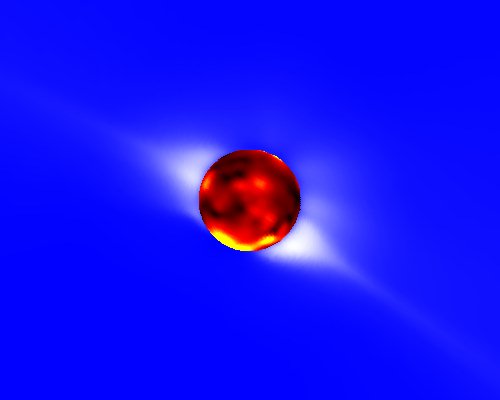
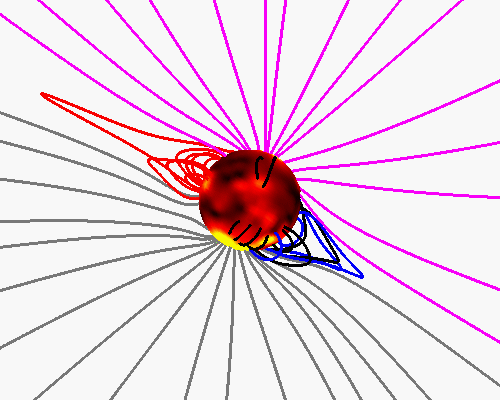
Predicted polarization brightness (pB) and traces of the magnetic field lines, in arbitrary colors, in the solar corona for March 9, 1997, at 1:00 UT (corresponding to a Carrington longitude of 257 degrees at central meridian). The pB signal is produced by white light scattered off electrons in the coronal plasma. The brightest regions, known as helmet streamers, occur where the magnetic field lines are closed. The image has been radially detrended to account for the fall-off of coronal brightness with distance from the Sun. Vertical (top) is geocentric (terrestrial) north. This is the view of the Sun that would be seen by an observer on Earth with a camera aligned so that vertical is toward the Earth’s north pole.
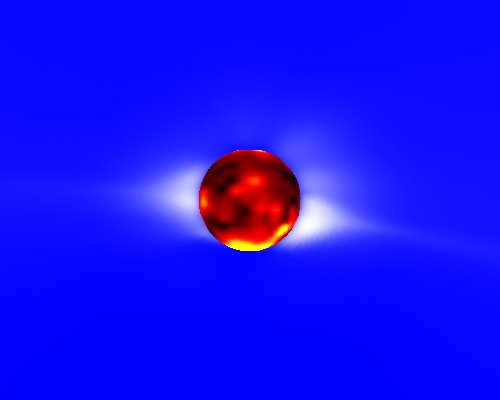
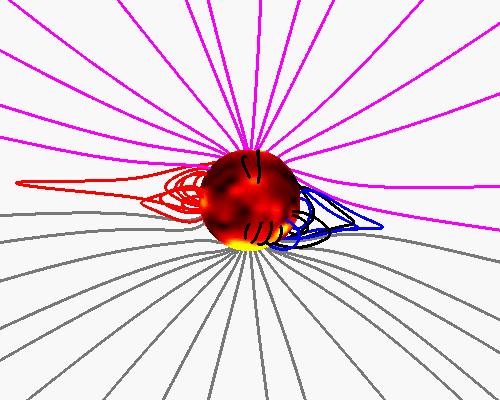
Predicted pB and traces of the magnetic field lines for the same calculation as above; here vertical (top) is heliocentric (solar) north. This is the view of the Sun that would be seen by an observer on Earth with a camera aligned so that vertical is toward the Sun’s north pole.
Comparison with an Eclipse Image
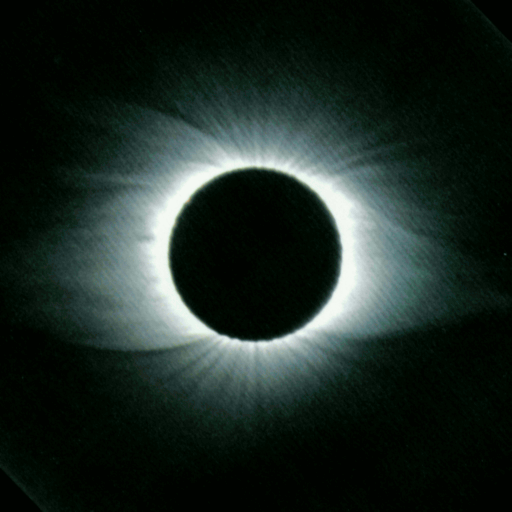
Eclipse Image(Meisei University)
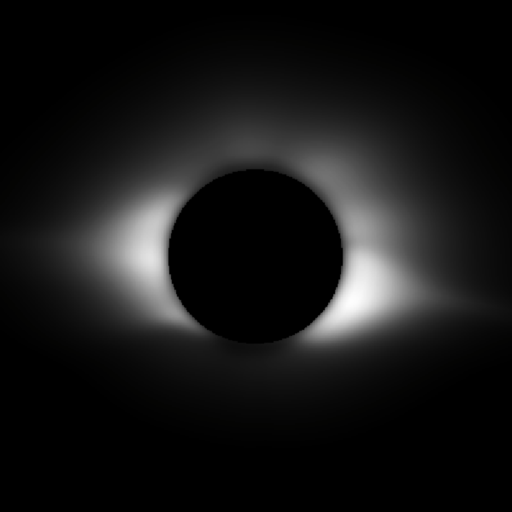
MHD Model PredictionPolarization Brightness
On the left, an eclipse image taken by the Eclipse Team of Meisei University, led by Professor Eijiro Hiei of Meisei University and the National Astronomical Observatory of Japan. On the right is the pB predicted by our MHD computation for the approximate eclipse time (Carrington longitude of 249 degrees). Vertical (top) is solar north. (The eclipse image was provided to us in digital form by Andy Stanger of the High Altitude Observatory (HAO). Also, thanks to Joan Burkepile of HAO for informing us of Professor Hiei’s successful eclipse expedition and the existence of the digitized image.)
Comparison with the Mauna Loa Coronameter
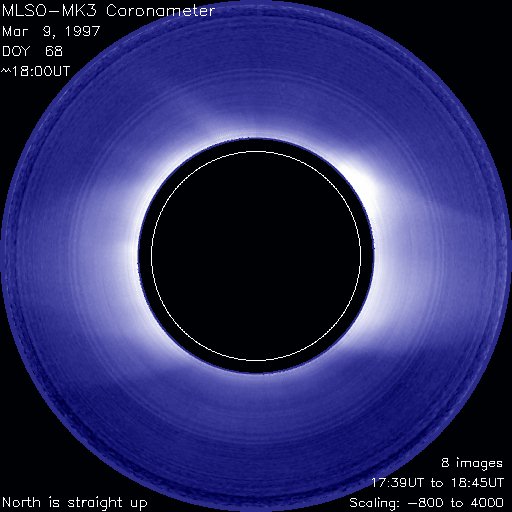
Mark 3 Coronameter(Mauna Loa Solar Observatory)
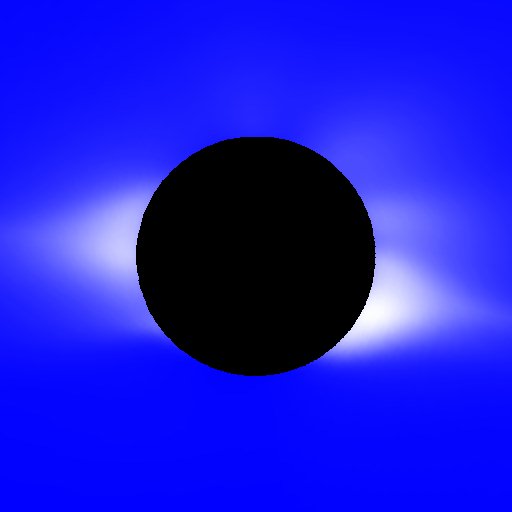
MHD Model PredictionPolarization Brightness
On the left is an image of the polarization brightness (pB) from the Mark 3 Coronameter at Mauna Loa Solar Observatory taken on eclipse day (March 9, 1997 at 18:00 UT). The black occulting disk extends to about 1.1 solar radii, and the inner white circle shows the Sun’s radius (approximate height of the photosphere). On the right is the pB predicted by our MHD computation for the same time (Carrington longitude of 249 degrees). Vertical (top) is solar north.
Comparison with the LASCO Coronagraph
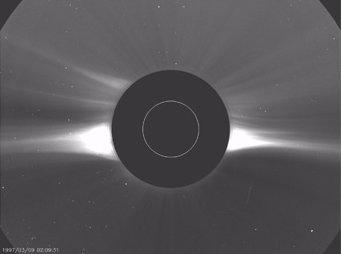
LASCO C2 Coronagraph(SOHO)
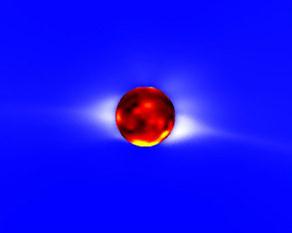
MHD Model PredictionPolarization Brightness
On the left is a brightness image courtesy of the LASCO C2 coronagraph aboard the SOHO spacecraft. (SOHO is a project of international cooperation between ESA and NASA.) The image was taken on March 9, 1997 at 02:09 UT. The occulting disk (black region) extends to about 2 solar radii. The radius of the photosphere is shown by the inner white circle. On the right, pB predicted by the MHD computation, scaled to the size of the LASCO image. Vertical (top) is solar north.
Movies from Carrington rotations 1918 and 1919 are available on the original CR1918/CR1919 page.
Archived prediction, converted from the original 1997 page.